# Examine Program Flow
Wire-Cell follows the dataflow programming paradigm that models a program as a directed graph of data flow between operations. The dataflow graph is defined by a top-level jsonnet file. For instance, in the previous "Explore Real Data" example, Wire-Cell executed this jsonnet file (opens new window) to perform the entire signal processing chain on ProtoDUNE-SP raw data.
# Dump configurations
We can visualize the dataflow graph, called pgraph (opens new window) in Wire-Cell, to better understand how the program runs. First, we can dump all the configuration into a single json file
jsonnet -V reality=data -V raw_input_label=daq \
    -J cfg cfg/pgrapher/experiment/pdsp/Quickstart/raw-to-sig.jsonnet \
    -o a.json
2
3
The output a.json is a huge JSON file that contains all the pgraph and configuration parameters. It may be difficult to read. Certain tools such as jq (opens new window) can be used to parse the JSON file at command line. In the following, we use another tool wirecell-pgraph to visualize the pgraph.
TIP
The -V option to jsonnet command specifies the values of external variables defined in the jsonnet file by std.extVar(). These variables are not set in the jsonnet file itself, but must be passed in by external programs.
# Visualize pgraph
The wirecell-pgraph tool relies on the graphviz package, so do sudo apt install graphviz if it's not installed.
Assuming that you have followed the previous instruction to setup your python virtual environment called wcpy. Inside the wcpy environment, do
wirecell-pgraph dotify --jpath -1 --no-params a.json flow-simple.pdf
, which produces the following dataflow graph
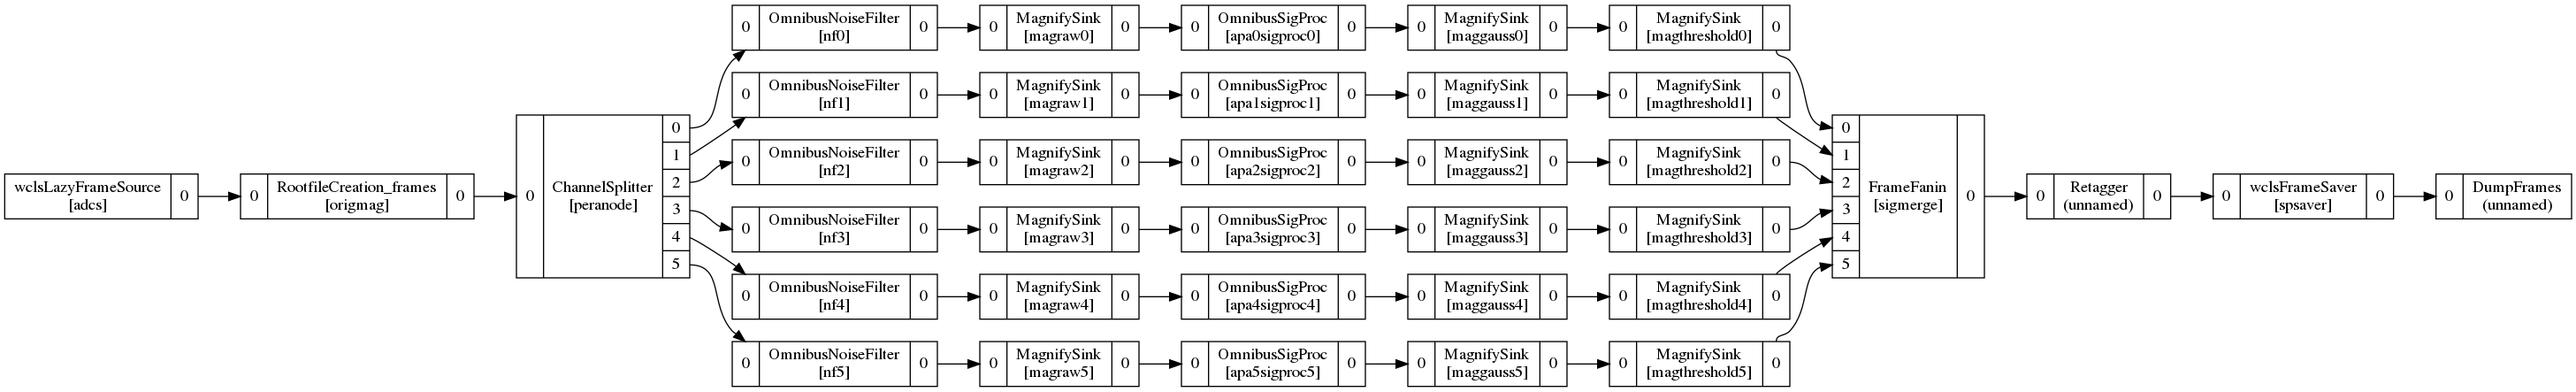
Ignoring the several Magnifysink nodes which outputs ROOT histograms for debugging, this graph is rather simple and clearly show how the data from 6 APAs are fanned out to be processed individually with the OminbusNoisefilter and OminbusSigProc nodes, and merged back into the stream after signal processing.
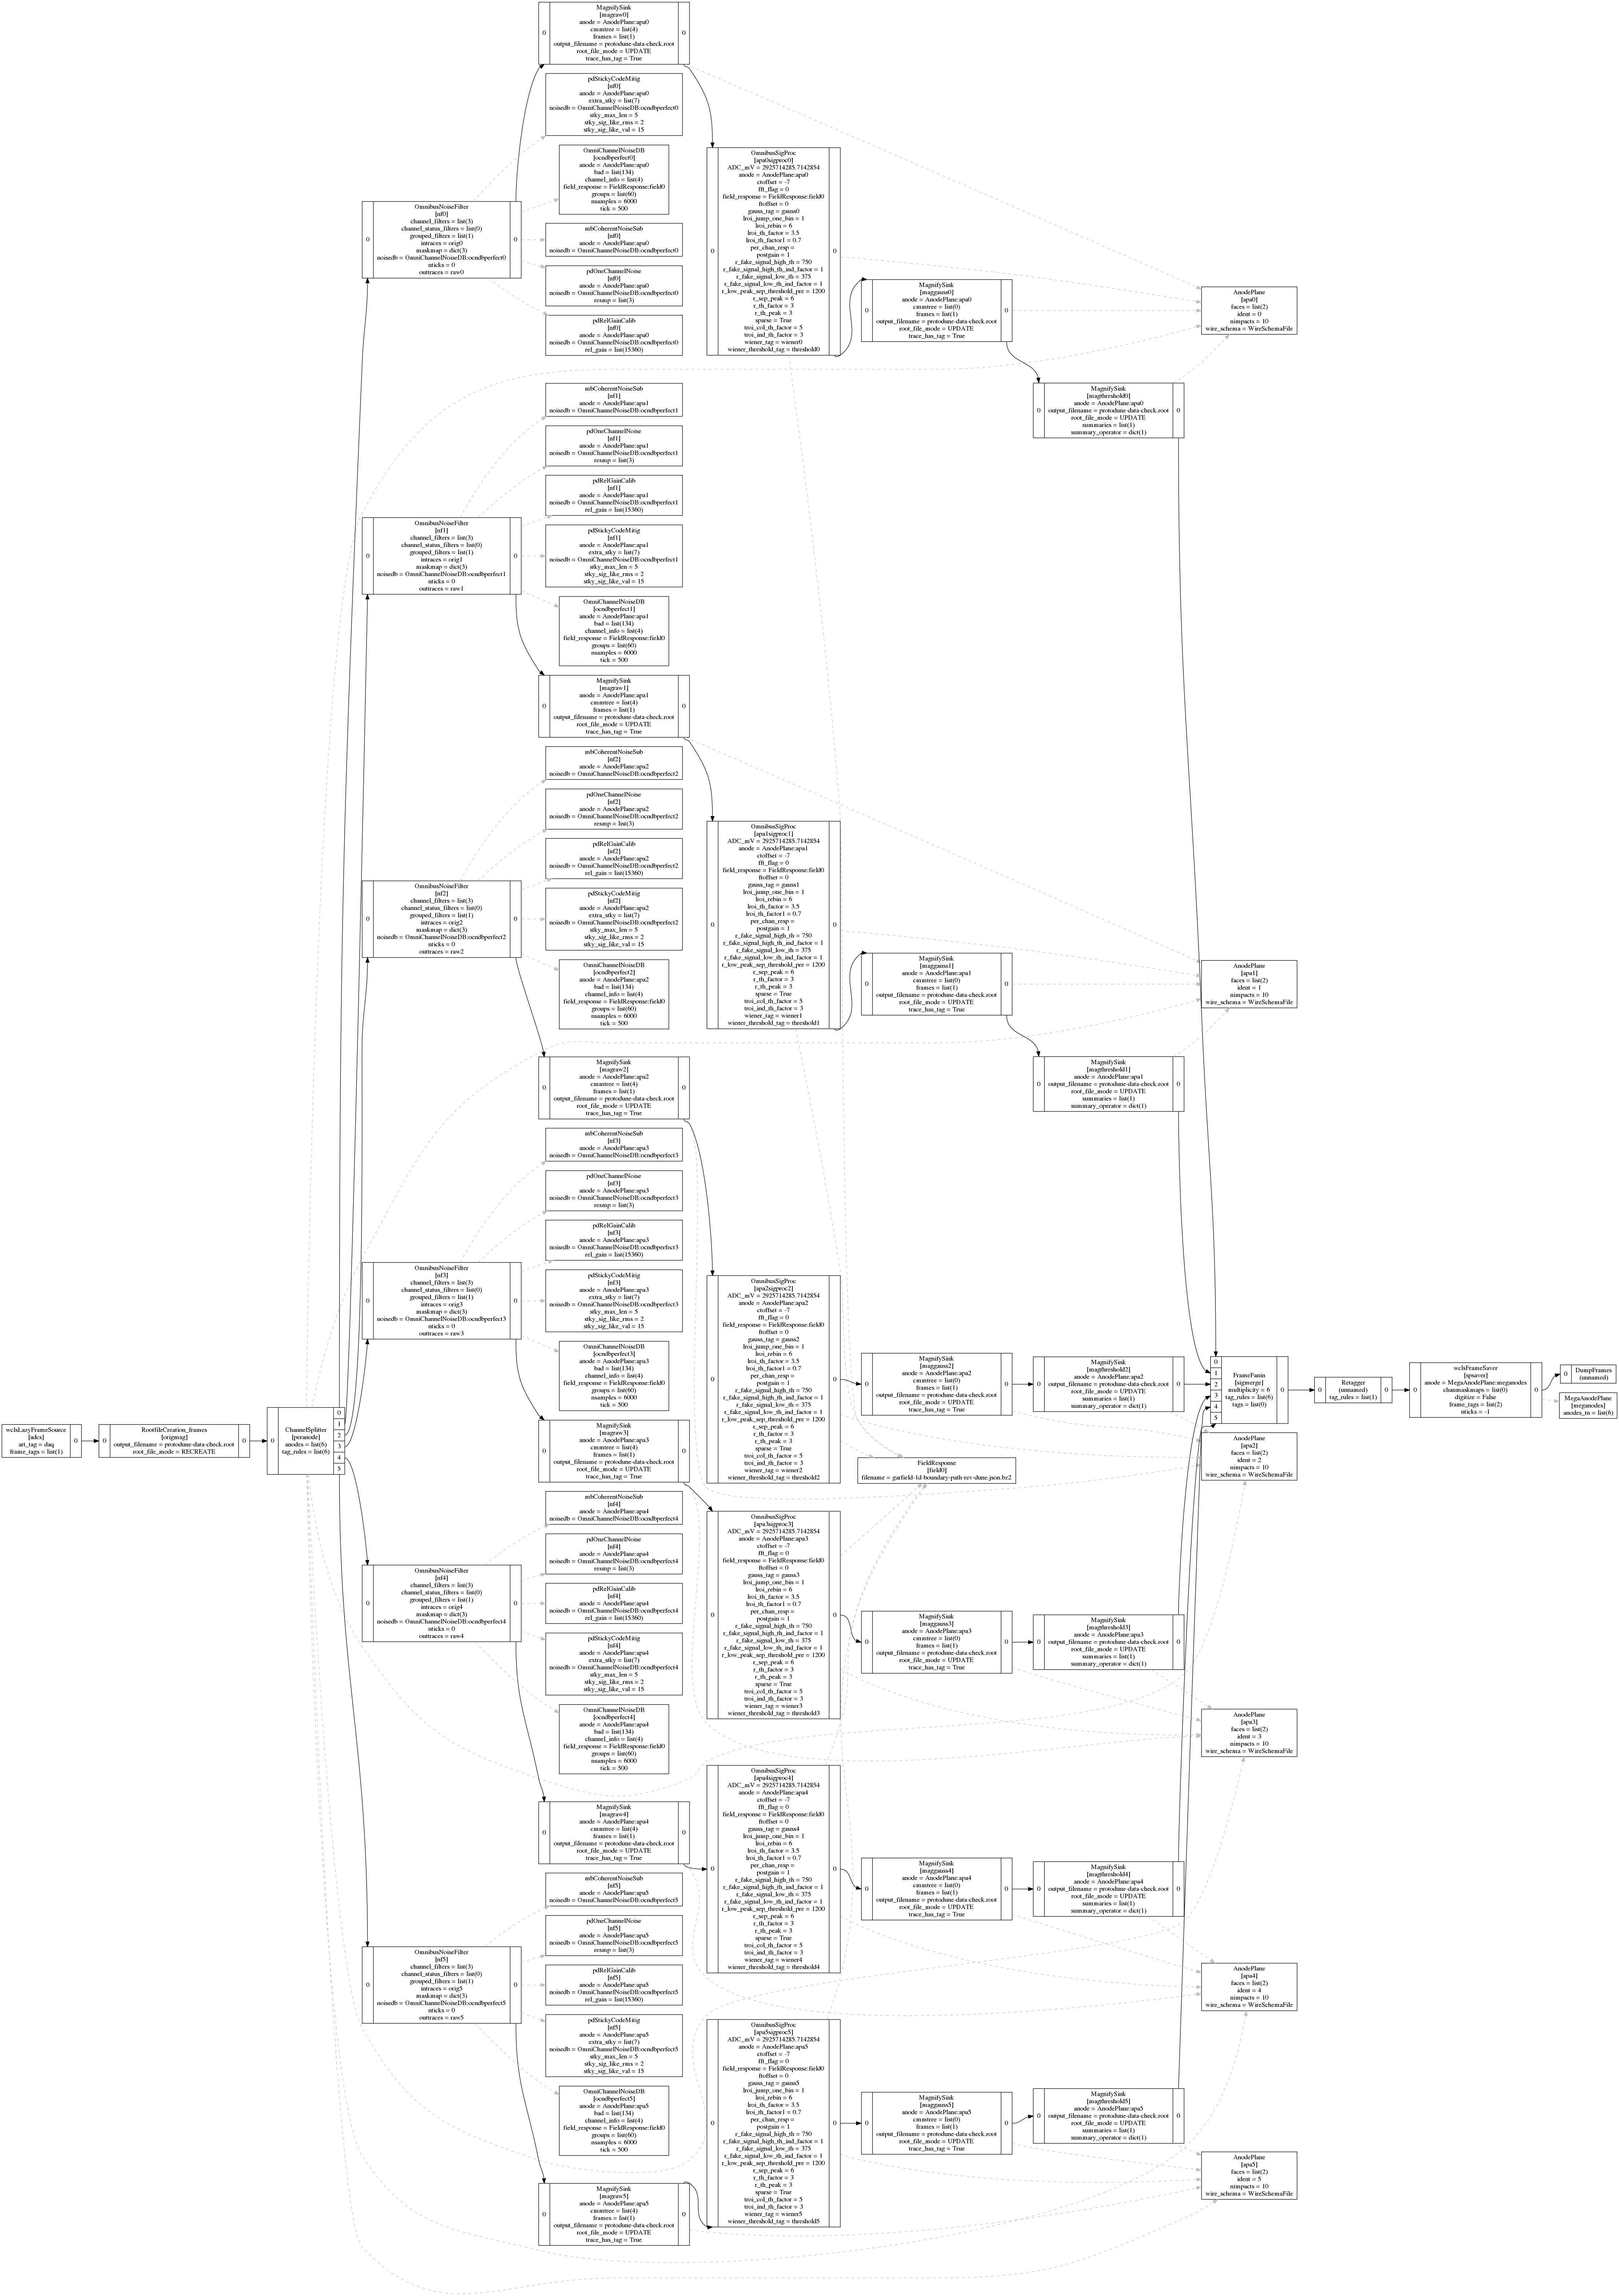
If you omit the --no-params option, the output will also contain all the configuration parameter values, resulting a much detailed graph useful for debugging: